Let’s play a quiz. The graphs below show the 7-day rolling averages of daily reported Covid cases and Covid vaccine doses in July and August. Can you guess which is which?
I know what you’re thinking.
Answer time. The top shows the daily doses, which were mostly 4th doses (taken by 57.7% of over 60s as of writing). The bottom shows daily cases. I’m sure any resemblance is purely coincidental.
Funnily enough, similar coincidences have occurred after 4th mRNA injections in the US too!
And if you were wondering whether this coincidence is limited to 4th doses for people over 50, Covid-19 was also the most commonly reported serious adverse event after the 3rd dose for people over 12.
I guess the CDC will just have to change the definition of “vaccination”. Well, it won’t be first time. It won’t even be the second.
Ah, but the above results were for the original gene juice. Luckily for Japan’s legions of mRNA loyalists, they’ll soon the the chance to try not only the new BA.1 jabs but also the even newer B.5 jabs too!

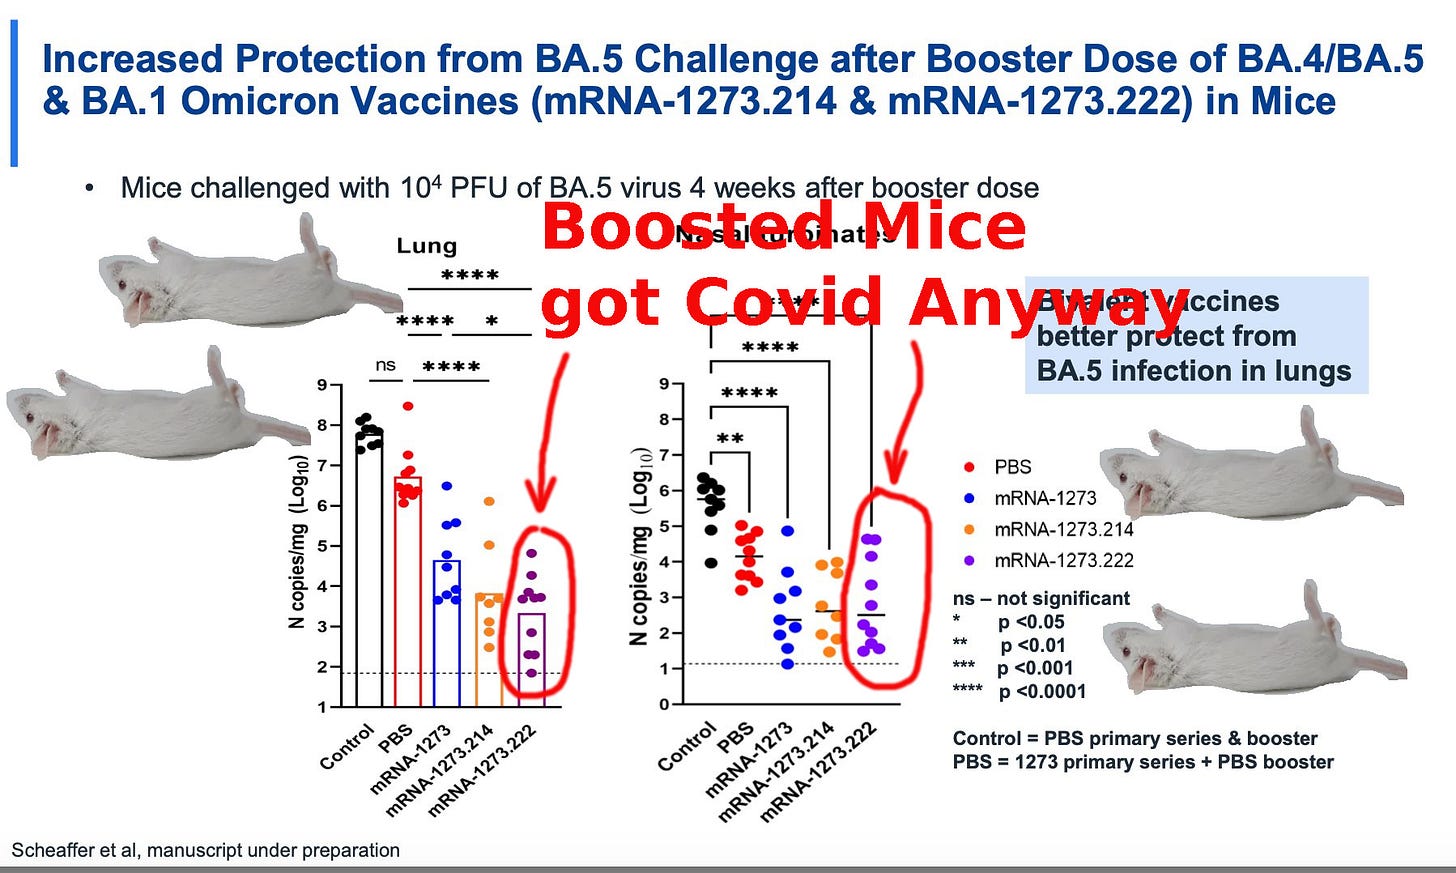
And just because the BA.5 jabs don’t work in mice doesn’t mean they won’t work in humans (hat-tip Igor Chudov).
After all, the mRNA for Moderna’s updated jabs is made by National Resilience, a company with links to an organisation with a long history of putting shots into people.
The shots have killed a lot of people though. And so have the CIA’s!
I’ll get my coat.


https://twitter.com/stevin2021
https://twitter.com/mconceptionz
Show plenty of OWID data showing clear correlation between faccines, cases, hospitalis and deaths
Fozzy the Bear style puns and bad jokes can be the icing on about any humorous cake