Wait Two Weeks! Evidence of higher Covid infection and death risk immediately after vaccination (Updated 11th April)
The below graphs were produced last week in an analysis of recent severe and fatal cases by Japan’s Coronavirus Response Advisory Board. Of the 553 recent fatal cases with known vaccination status, double-jabbers clearly outnumber triple-jabbers, about 420 to 50.
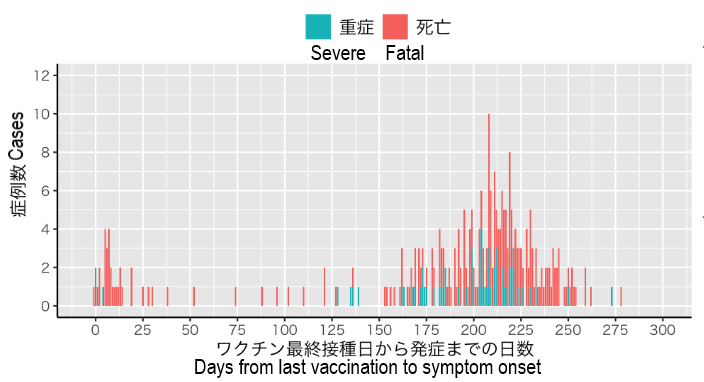
The next graph shows the time from last vaccination to symptom onset for the 61 severe and 225 fatal cases for which this data was known. The vast majority of deaths occurred after 150 days had elapsed since the second jab. All this means the double-jabbers would be advised to roll up their sleeves again for a booster, right?
But before you rush off to the nearest shooting gallery, let’s take a closer look at the last graph, shall we?
About 25 of the fatal cases developed symptoms within three weeks of their last jab, most of which we can safely assume to have been the third one. This is pretty impressive since there are only 50 confirmed triple-jabbed deaths in the dataset.
This is yet more evidence of higher Covid infection risk immediately after vaccination, which was noticed over a year ago and named “魔の2週間” (Ma no 2 shukan, The Devil’s Two Weeks) by Jun Sato, the doyen of Japanese Covid-data Twitter, and more recently investigated by El Gato Malo, the Sherlock Homes of Bayesian data crime.
Most studies on vaccine effectiveness omit the period directly after vaccination, but once this immediate post-jab risk is factored in, vaccine effectiveness against death is shown to be statistical smoke and mirrors. But luckily for the vaccine manufacturers, the Ministry of Health, Labour and Welfare employs some of the best data magicians in the business…
…and the Japanese media know a few tricks too.
74% of Covid hospitalisations in Ibaraki not vaccinated with the third shot
7/4/2022 Update
Since the MHLW have updated their data, I guess I should update this post. I had assumed the severe/fatal cases who were infected within the Devil’s Two Weeks had been boosted, but now we know they were. As you can probably work out, blue means 3 shots, green means 2 shots, and red means 1 shot.
And the median time to symptom onset for the boosted in this dataset is 8 days.
Which goes to show, the third shot isn’t called a booster for nothing.
11/4/2022 Update
If you’ve come here from Andreas Oehler’s Substack post discussing the post above, you’ll probably be interested in the post below.


