You can't be serious! Why Japan's severe case numbers on Our World in Data can't be trusted (Updated 26 April 2022)
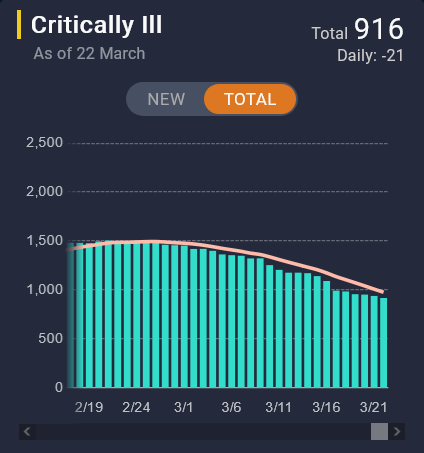
Anyone interested in Japan’s Covid data would generally be recommended to check the English version of business magazine Toyokeizai’s Covid data-tracking site, which sources data from Japan’s Ministry of Health, Labour and Welfare (MHLW). For example, here is the MHLW data for critically ill Covid cases.
And here are the MHLW’s numbers for critically ill cases in each of Japan’s 47 prefectures.
Er, so why does Osaka have more severe cases (571) than the other 46 prefectures combined (345)? Did people there stop wearing masks?
Well, according to Osaka Prefecture’s own data, there are only 110 severe cases in Osaka, over 5 five times lower than the MHLW’s number.
So what’s going on here? We’ll have to take the bullet train up to Tokyo for the answer.
So if Tokyo used the MHLW’s criteria, Tokyo’s number of severe cases would go up over 10 times, from 40 to 407.
So how are severe cases defined by Tokyo, Osaka, and the MHLW?
A severe case in Tokyo is a Covid patient on ECMO or a ventilator.
A severe case in Osaka is a Covid patient on ECMO, on a ventilator, or in an ICU for Covid.
The MHLW used the same definition as Osaka up till 24th August 2021. But then the MHLW expanded its definition to include Covid-positive patients in any kind of ICU, including critical care units, stroke care units, perinatal ICUs, and neonatal ICUs regardless of the reason for admittance.
In other words, the same way as a Covid death is defined as anyone who dies for any reason after (or even before) testing PRC positive, the MHLW now defines a severe Covid case as anyone in intensive care for any reason after testing PRC positive. This means that 461 of the severe cases in Osaka per the MHLW’s current definition (50.3% of the national total) most likely aren’t actually severe cases of Covid and wouldn’t have been counted as such previously.
Confusingly, when summing up the national total, the MHLW uses Tokyo’s own numbers but not Osaka’s, leading to Osaka’s artificially high numbers in the Toyokeizai bar chart above.
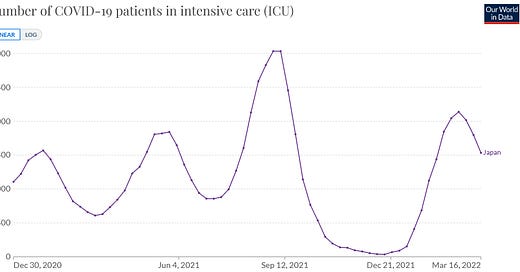
Even more confusingly, Japan’s Covid ICU numbers on OurWorldinData (OWiD) include the MHLW’s numbers for Tokyo, which is why they are higher than the critically ill numbers on Toyokeizai. And for extra confusion, recent ICU numbers can’t be compared with those in waves prior to August 2021 because of the expanded definition. For example, OWiD shows Covid ICU cases peaked noticeably higher in February 2022 than in January and May 2021…
…but Covid cases on ECMO and mechanical ventilation (i.e., Tokyo’s definition of severe) in February 2022 peaked noticeably lower.
So we can add severe cases to the list of things the MHLW can’t/won’t count properly, along with Covid-related myocarditis and Covid deaths by vaccination status. I guess they should just stick to the one thing they can actually do: extending vaccine expiry dates.
Update 26/4/2022
A miraculous thing happened a few weeks ago: the number of severe Covid patients in Japan fell from 467 to 230 overnight!
But to what do the Japanese owe this good fortune?
Breaking: 230 severe covid patients in all Japan. By applying Osaka’s “new criteria,” the number has halved from the day before
Well, Osaka’s new criteria are the MHLW’s old criteria, but whatever. But OWiD is still using the MHLW’s more “inclusive” number of 736 as of today, so if you want to know the number of actual severe Covid cases, go to Toyokeizai.


